Peppermint Oil and Ethyl Vanillin 11 years ago
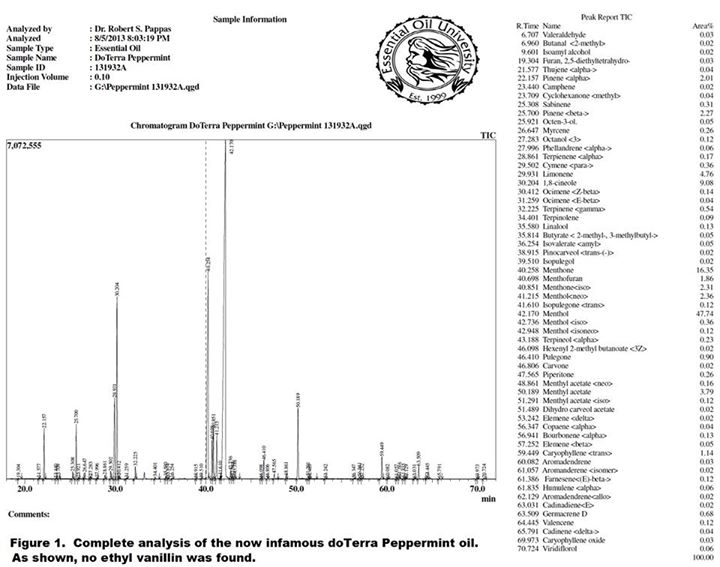
Since so many people have asked me to comment on this I figured I would take some time to put to rest any misinformation that’s been floating around out there, since this directly calls into question my results and abilities. First, I wanted to publish the full GC/MS analysis of the early 2013 lot of doTerra peppermint reported on which was claimed to have contained a trace of ethyl vanillin (see figure 1).
As you can see from the report in which we looked at everything down to 0.01%, there is no finding of ethyl vanillin in the oil, despite what was claimed on certain other websites. So I guess it comes down to a matter of trust and who one chooses to believe on this issue. Before making that decision on who to believe however, it would at least be prudent for one to become educated about many aspects of the report which claims to have found ethyl vanillin. There are several things I think that people who are not familiar with EO analysis should consider when evaluating my report versus that of the other lab:
1. Essential Oil University uses the very latest GC/MS technology on two state of the art instruments (getting ready to purchase a third very soon) including one instrument for dedicated chiral analysis. Our primary instrument is a Shimadzu GCMS QP2010 Ultra which has quite a bit more sensitivity than the much older 5890 series Agilent instrument used by the other lab. In addition to greater sensitivity, the Shimadzu instrument is well known by those of us familiar with both Shimadzu and Agilent, to give more quantitatively accurate MS results than the Agilent 5890 series. In my initial report on this oil I only included 30 or so components from an auto-generated quick report because those components are typically the ones most customers are interested in for peppermint oil. People had made accusations that somehow my methods were not as good because I could only see 30 components, but that was not the case at all. In that initial report we intentionally did the cutoff for the 30 typical main components. In this report we expand the report out to look at everything down to 0.01% which gets us to 60 or so components. We could expand the report out to the 0.001% level but we still see no ethyl vanillin. In addition, we don’t typically report on components out to 0.001% because most people in this industry realize that the accuracy of the identifications on trace components pulled from the MS library are considerably less than 100% certain, even when searched on components at 0.1% or less, let alone ones pulled from 0.01% or less. An analyst can certainly report what his MS is identifying at say 0.07% but that doesn’t necessarily mean there is a high degree of certainty in what the library is assigning as the component ID.
2. At EOU we use the industry standard non-polar DB5 column for most applications. There is a reason that DB5 is the standard and its because it gives the best separation and best overall results for essential oils. It is not known why the other lab chooses to use the older polar carbowax type column (in this case HP Innowax). When this column is used it makes it impossible to really compare with the results of other reputable labs because the retention order of the components is drastically different than on the non-polar DB5 column. Perhaps non-uniformity with other labs is intentional, making comparison difficult and not subjecting oneself to scrutiny over potentially misidentified components or perhaps its just inexperience. But there is no question that DB5 or similar non-polar is the column of choice for essential oil analysis.
3. The other lab used a dilution of peppermint in hexane which means there is just one more variable introduced along the way for the possibility of trace contamination to occur. When solvents are used they are typically pulled from a large container used over and over again and over long periods of time the solvent inevitably becomes contaminated with trace components which is why when reporting on trace elements, careful measures have to me made to insure that the source is not secondary contamination.
4. In addition to our own custom component library with thousands of components specific to essential oils and fragrances created by running pure authentic component samples, EOU also uses the latest commercial libraries for its component identifications including the latest Wiley library with over 400,000 mass spectra. The other lab used an older NIST library with only 75,000 mass spectra for its source of identification of the components. Furthermore, most people in the industry realize the severe short comings of the government sponsored NIST library which has a considerable number of errors in it.
5. The chain of custody on the reported peppermint of the other lab is HIGHLY QUESTIONABLE. The lab report does not even state a doTerra lot number, and in fact, the report does not even claim the sample is a doTerra oil. The name of the file for the analysis was HARRIS/MPDT8952. This means the sample, if indeed actually was originally a doTerra oil, was transferred to another bottle and re-labeled. This gives yet another point of potential contamination, again assuming that the sample actually was a doTerra oil initially. The lab who did the report would not, and indeed could not, claim on the report that this was a doTerra oil because they know they could not verify it as such. A prime example of the complete incompetence in the sampling process can be demonstrated by viewing her own videos on youtube. Back when Lea Harris sent me samples of Myrrh oil for analysis from various companies she clearly records in this video ( http://youtu.be/1u-E6Wknw5A ) that the Young Living sample is #1 and doTerra is #5. But when you go to the site where she reports the results she lists doTerra as #1 and Young Living as #5 ( http://www.nourishingtreasures.com/index.php/2013/04/17/essential-oils-testing-and-the-results-are-in/ ). In my opinion none of the testing results on any site controlled by Lea Harris can be trusted, not because of the labs used but because of her own incompetence in the sample preparation process.
6. The component percentages do not match the percentages that we get and that we have confirmed with other labs for this lot of oil. For example, they report a menthol content of only 42%. I can tell you I have never seen a doTerra lot of peppermint oil with that low of menthol content. The lot in question was closer to 48% menthol which is in line with what doTerra menthol levels consistently run in their peppermint oil, at least all the samples they have sent me for analysis.
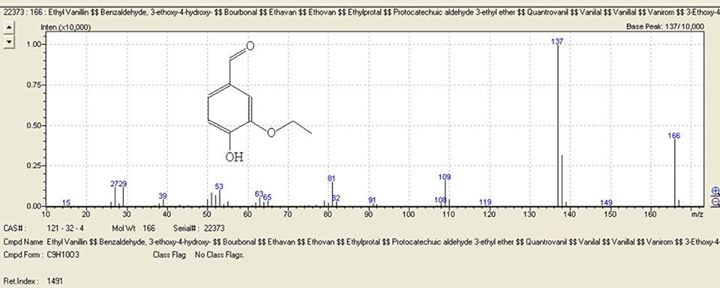
7. Finally, its entirely possible that the ethyl vanillin peak claimed to be present at only 0.07% was actually a misidentification of another trace component of peppermint oil that perhaps the analyst did not consider. Ethyl vanillin has molecular weight of 166 and when its in pure form in reasonable concentration it has the mass spectrum shown in Figure 2. Note the main mass fragments of ethyl vanillin are at 166, 137, 138, 109 and 81. Consider also that this is the mass spectrum when ethyl vanillin is in pure form with no interference from other co-eluting components, as can happen in complex mixtures. When extremely dilute and when other components are co-eluting this spectrum can be altered. Now take a look at the mass spectra of a naturally occurring trace peppermint oil component called iso-mint lactone, a little known component of mint oil (Figure 3). As you can see, iso-mint lactone contains the same main mass fragments at 166, 137, 138, 109 and 81. Again this is the spectrum for the pure component with no interference from other co-eluting components. When in extreme dilution or when interference with other components in a complex mixture occurs (like in essential oils) this spectrum can look different in its relative peak intensities. Furthermore, the retention time of iso-mint lactone is almost exactly the same as ethyl vanillin!! Its entirely possible that the other lab mistakenly identified iso-mint lactone as ethyl vanillin in such a dilute concentration. Even an experienced analyst could make this mistake. The analyst of the other lab identified mint lactone but does not list its cousin iso-mint lactone and most likely does not have this mass spectrum in his library and even if it were there, confusion of the computer between two similar mass spectra happens all the time, especially when you are looking at components in such small concentration.
In conclusion, its not really known exactly what could have happened with the claims of ethyl vanillin in the peppermint sample but all I can say is that we have never seen ethyl vanillin in any sample of doTerra peppermint oil here at EOU and there are enough questionable practices and motives by the sites publishing these ridiculous results to doubt their accuracy. But as I have always said from the very beginning, if all you can find wrong with an oil is a HIGHLY SUSPECT trace amount of a commonly used, non-toxic flavor ingredient that, if it were actually in there (not believed to be the case), then you are really reaching anyway, especially when I can find way worse and highly toxic components and at higher levels in many of the mint oil samples sold by other companies, particularly in spearmint oil (see committing Adultery Chapter 3 on this FB page).


