What is NOT an Essential Oil Analysis Report 11 years ago
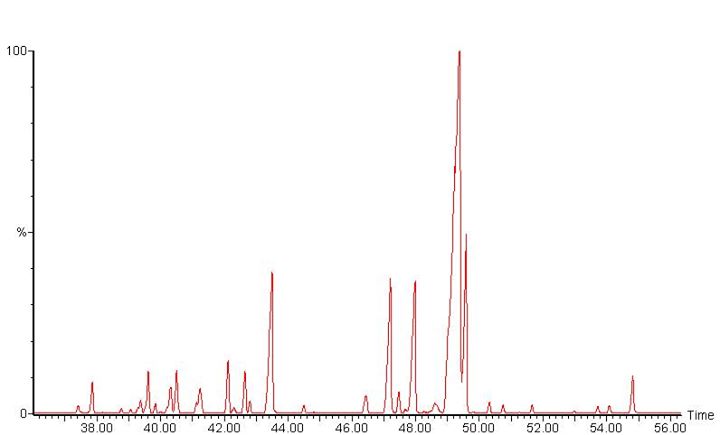
It always baffles me when my clients say they ask their suppliers for an analysis report and the supplier responds to them with a simple chromatogram like the one above. In case you are confused lets be perfectly clear, THIS IS NOT AN EO ANALYSIS REPORT. This is a "report" that either an ignorant supplier representative is just passing along because he doesn't know enough about analysis of essential oils himself to know what a true report looks like, or else its one sent by a supplier who has complete and utter contempt for his customer. The latter is usually the case. It's basically the supplier saying to his customer "I know you don't know anything about the chemistry of essential oils and all you need is a piece of paper that looks scientific to make you feel good about the oil I am selling you and you will go off and tell all your friends how wonderful and transparent I am as a supplier." This may seem harsh but sadly its true and happens many times in our industry.
What's even more baffling to me is how often the customer accepts this as some kind of meaningful data! Perhaps you are one who has settled for such a response from a supplier? Did you ever ask yourself why you were ok with it? Was the supplier right about you? Did you just need a piece of paper to feel good and no need to actually understand the piece of paper? Maybe you did want to understand it and just felt intimidated to ask questions or didn't want to look stupid by admitting your confusion. Well I am here to tell you that you should not feel stupid at all if you didn't understand it. I have spent almost 20 years of my life analyzing essential oils on a daily basis and if a supplier sent me a "report" like that I would not be able to understand it either!! You see, a chromatogram alone is nothing but a series of meaningless lines on a graph, it could be any chromatogram of any oil for all you know. The peaks on the graph simply represent relative abundance of a chemical component (the vertical or Y-axis) graphed as a function of Time in minutes (the horizontal or X-axis). But the graph alone doesn't tell you what the peaks are or their concentration in the oil, which is the only way to make any kind of judgement on the quality of the oil.
In short, without a table to identify the component that each peak stands for along with the percentage that each peak is present in the mixture then the supplier representative may just as well sent you a graph of his monthly drug testing analysis! And if your among those who think "well at least my supplier gives me something, thats more than other suppliers do" well then theres nothing I can do to help you with that because you see, your need to feel good surpasses your need for understanding. With a report like this in your hands you may feel good, but any thinking person can see that you have ABSOLUTELY no more understanding about the oil in question than you would from the supplier who gives you no report at all. And at least the supplier who doesn't provide any report at all doesn't have contempt for your intelligence!